The CanWaCH Analytics Portal (AP) is an interactive set of charts, graphs and images that display the combined data provided in the Project Explorer – a database that highlights key information for individual international development and humanitarian projects linked to Canadian funding and actors. The Analytics Portal aggregates and summarizes Project Explorer data producing totals by Country, Area of Focus, Population and Outcomes.
Visualize what the AP has to offer: Watch this mini video tutorial for a taste of interactive data storytelling
The AP is a user-guided tool that helps organizations deliver greater impact by answering questions on Canadian projects related to international development and humanitarian work.
A tool for planning and decision-making: The AP shows investment trends across health and development areas to support proposal writing and project development. How? It creatively displays understandable, relevant and accessible data on who is doing what, where, with whom and with what resources. You can also find tools, datasets, indicator lists and more.
A tool for improved partnership and coordination: Leveraging up-to-date data from partners themselves, the AP enhances your ability to identify potential ‘gap’ areas, as well as opportunities for improved partnership and coordination. How? Using maps and search filters, you can quickly find local and grassroots organizations, funders and other Canadian actors working in-country and connect with them directly.
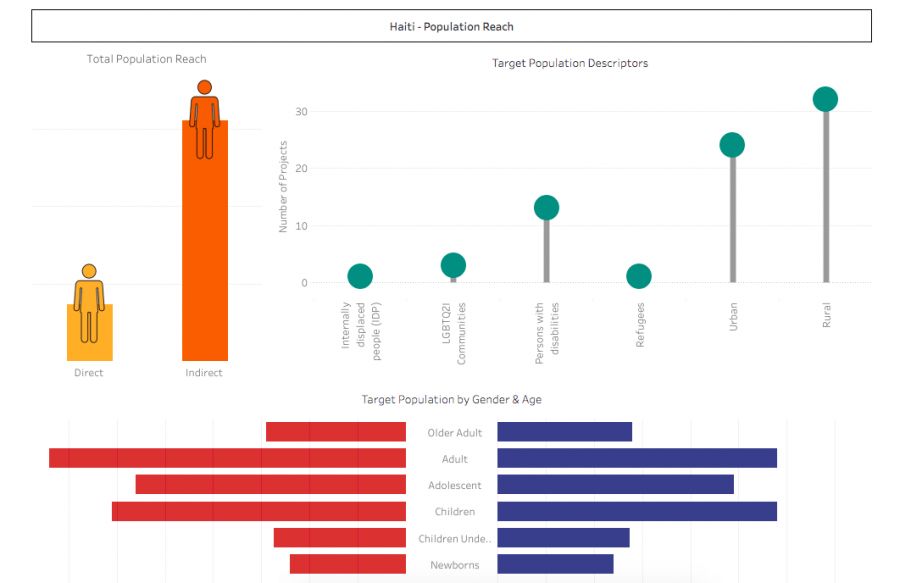
A tool for telling stories about Canadian impact: It leverages information and evidence generated by and with Canadian actors, and connects international and local partners with data about what is happening around the world. How? The AP produces visual summaries on impact totals and percentages by country, funding sources and investments, areas of programming, populations reached, project activities and more.
“What gets measured gets done’ describes succinctly why data is a prerequisite for action”
– Melinda Gates, Davos 2018
Interactive data is essential because it empowers the user to draw their own conclusions and have full access to open source information. Static, traditional formats like excel charts and graphs have significant limitations because users are unable to control what information is included.
The CanWaCH Analytics Portal supports users to explore, play and enquire, enabling you to answer any question with transparency and confidence.
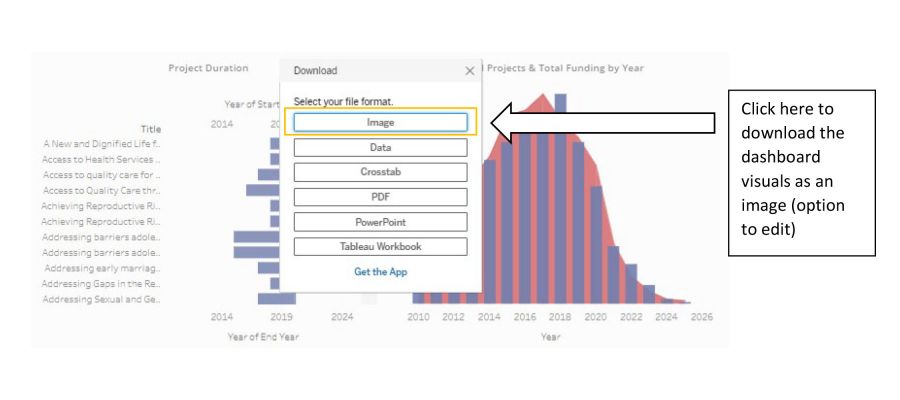
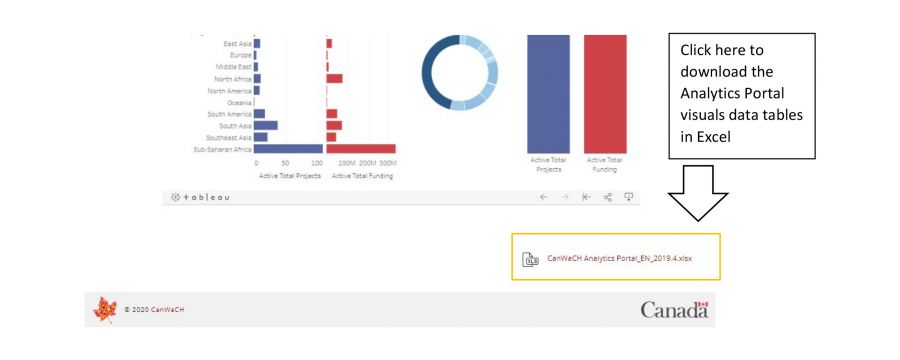
How to merge and utilize visuals from the Analytics Portal when:
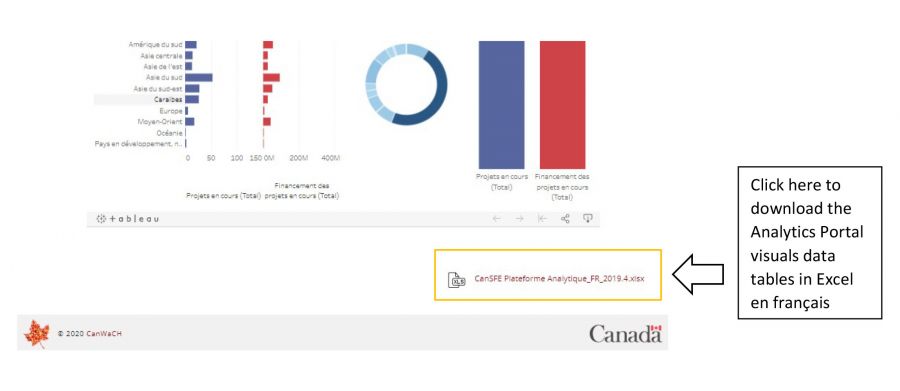
The CanWaCH Analytics Portal is 100% Open Source with the Excel Files included.
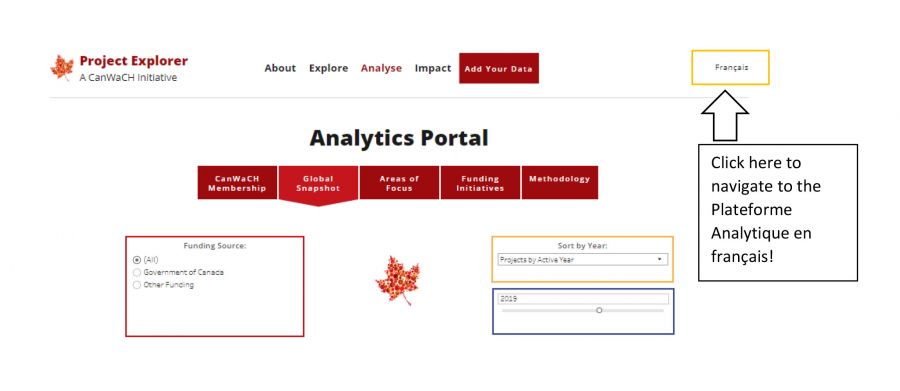
Want the Excel File in French?
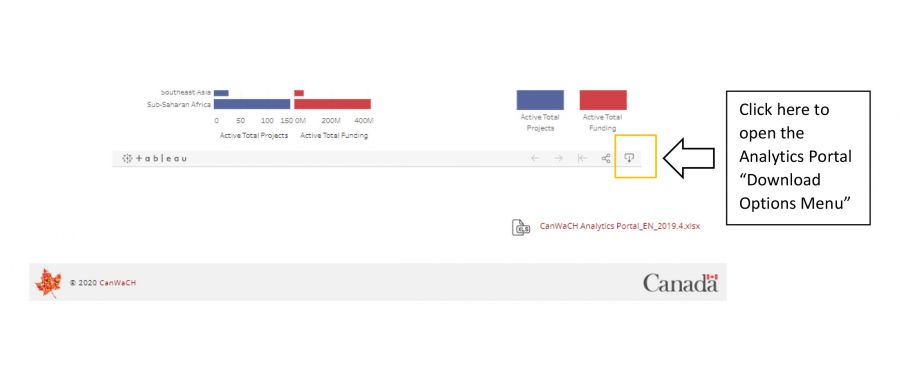
Step 1:
Step 2:
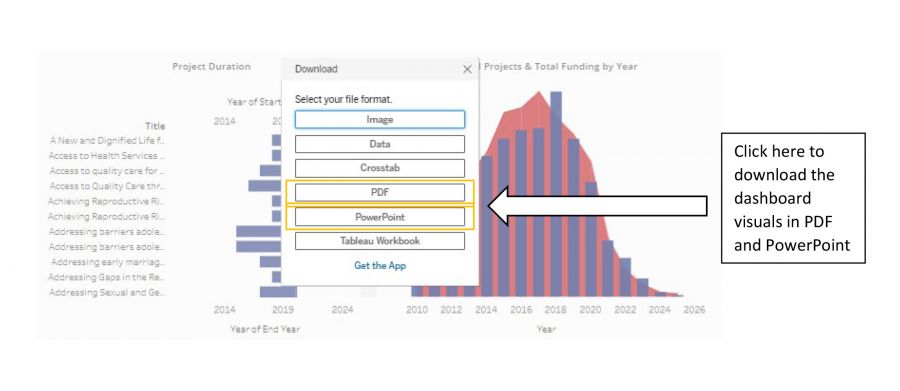
Step 1:
Step 2:
Step 1:
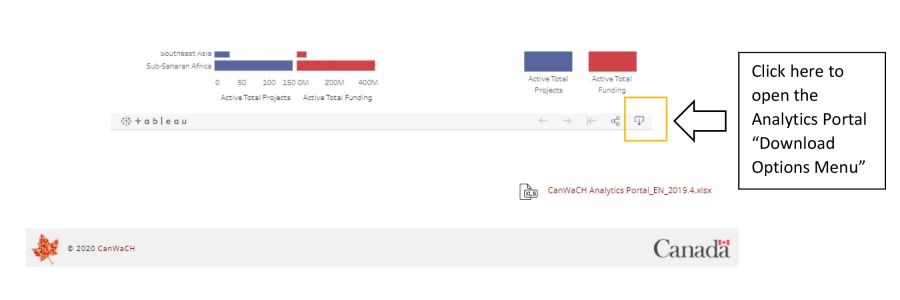
Step 2: